Questions On Quantitative Techniques SMQTQ010

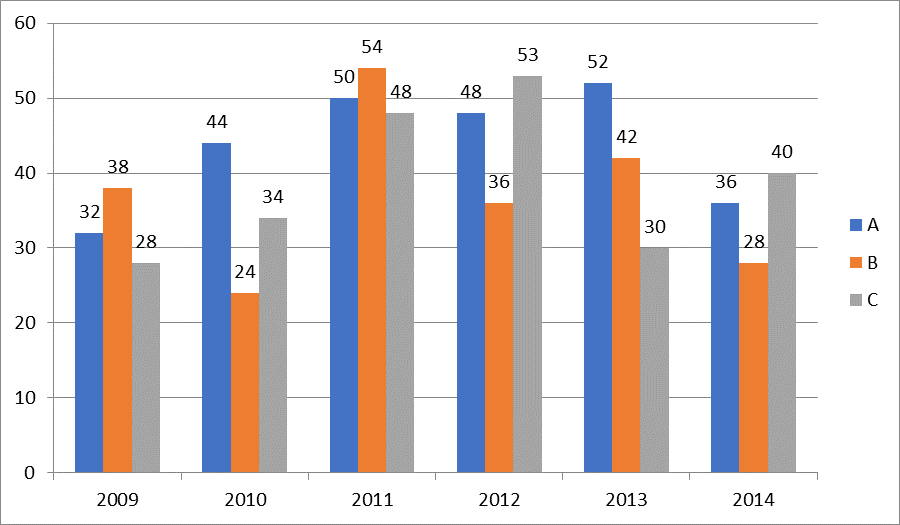
Direction: Study the following bar chart carefully and answer the questions given beside.
A silver coins produced by three different companies-A,B and C. The production of silver coins over a period of six years has been expressed in the bar graph provided below.
Production of silver coins in lakhs.

Q.1) In which year, the average output of the 3 companies together (for that year) is the fourth highest in terms of production?
a) 2009
b) 2010
c) 2012
d) 2013
e) 2014
Q.2)Sum of production of silver coins by company A and production of silver coins by company B in the given period is approximately what percentage of total production of silver coins by all the three companies in 2009 and 2012 together? (Approximately)
a) 208%
b) 219%
c) 209%
d) 206%
e) None of these
Q.3)The average production of silver coins by company B in 2009, 2010 and 2011 is what percentage the average production of silver coins by company C in 2012, 2013 and 2014?
a) 95.43%
b) 94.32%
c) 84.52%
d) 82.02%
e) None of these
Q.4) what is the difference (in lakhs) between the total silver coins produced by company A in all the years together andtotal silver coins produced by company C in all the years together.
a) 35
b) 32
c) 30
d) 38
e) 29
Q.5) silver coins produced by company B in 2013 is what percentage more than the silver coins produced by company B in previous year?
a) 17.9%
b) 12.45%
c) 19.8%
d) 16.67%
e) 15.23%
Correct answers:
1. e
2. d
3. b
4. e
5. d


